When the Forced Seller Leaves, the Buyers Come Back
- Christopher Garliss
- 2 minutes ago
- 5 min read
Editor's Note: In late July, I noted that technology stocks were oversold. At that time, Leopold Aschenbrenner's AI-focused hedge fund, Situational Awareness, was forced to liquidate the bulk of its stock portfolio after steep losses on the year — reportedly in a single block trade with Citadel on the other side. The scramble to sell ahead of that liquidation was a major contributor to the tech-stock weakness. But once the fund's book was cleared, the market's biggest known forced seller was out of the way, and the 9% rebound that followed has left traders increasingly convinced a near-term bottom is in for the AI trade.
That thesis picked up more support last week. Wells Fargo flagged an increasingly constructive backdrop for stocks, pointing out that Commodity Trading Advisors (CTAs) have flipped to net buyers. In other words, the oversold setup identified didn't just stay a chart pattern — it's already showing up in the flows. Here's the original note:
Bull Markets Don’t Die on Fear — and Right Now, Fear Is All There Is
The relative strength index is approaching oversold levels.
Similar drops since 1980 have led to long-term buying opportunities.
The Nasdaq has averaged a 38% rebound over the following 24 months.
The recent drop in technology stocks is getting close to overdone…
July is typically a solid month for stock market investors. Since 1928, the S&P 500 has averaged a 1.7% gain in July. That has historically marked one of the strongest monthly performances of the year. When you consider it accounts for almost 20% of the S&P 500’s average annual gain of 9.7%, the numbers are even more impressive. However, so far this month, the index is down 1.7%, well below seasonality.
The major driver of the underperformance has been momentum investors exiting the technology sector — which is why the damage shows up far more clearly in the Nasdaq Composite than in the broad market. With company demand for compute power rising, the hyperscalers who provide the data center space are trying to build capacity to meet that demand. To do so, they’ve been tapping the debt and equity markets, and their free cash flow has dropped as capex outruns operating cash.
As a result, investors are increasingly questioning the ability of these companies to keep spending. They’re worried that at some point, an inability to borrow or sky-high interest rates will put an end to the spending cycle. And as we can see in CNN’s Fear and Greed index, investor anxiety has spiked…

The reading sits deep in “fear” territory. Yet typically, when Wall Street becomes this nervous, it proves to be overdone. When momentum investors grow uncertain, they tend to sell first and ask questions later — raising cash so they have money to put back to work once the picture clears.
Goldman Sachs’ Prime Brokerage unit recently said that the sale of technology stocks by momentum investors had reached an all-time high. It noted that the last time we’ve experienced anything this close was at the depths of the financial crisis as well as the dotcom bust. And based on the relative strength index, all of that selling has pushed tech stocks close to oversold territory. That should support a rally in the Nasdaq Composite as investors’ worries are placated.
But don’t take my word for it, look at what the data’s telling us…
The Nasdaq Composite’s relative strength index (“RSI”) is a simple momentum gauge that shows when buying or selling pressure has pushed too far in one direction. It runs on a scale of 0 to 100. Readings above 70 hint that buyers have overextended themselves, while drops below 30 suggest sellers have done the same. It doesn’t forecast fundamentals, it just tells you whether recent price action has been one‑sided enough to matter, often before the chart itself starts to turn.
As of yesterday, the gauge had slipped below 35 — its lowest reading since March and closing in on the 30 line. It hasn’t crossed into oversold territory yet. But it’s close enough that the history of what happens when it does is worth knowing…
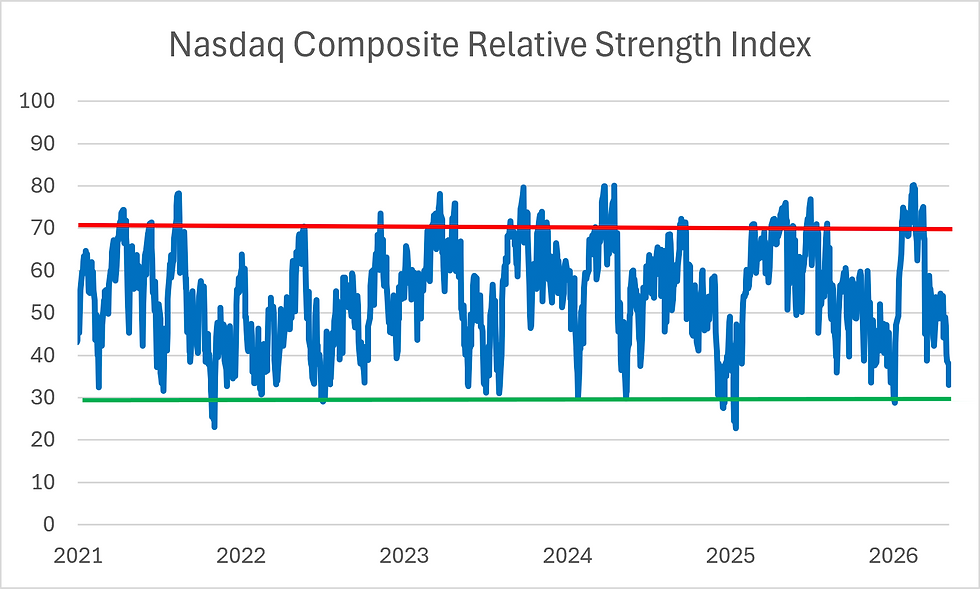
Given the drop, I wanted to see how the Nasdaq has performed after similar readings in the past. I focused on the cleanest version of the signal — a full move into oversold territory — and ran the numbers back to the start of 1980. What I found was there have been 127 instances where RSI has hit 30 or below.
Historically, those types of pullbacks have led to above-average returns for the Nasdaq Composite. The 12‑month price return numbers stand out: a 21% average gain with an 82% success rate, well ahead of the Nasdaq Composite’s long‑term 10.7% annualized return…

I find data like this especially timely given the Nasdaq is off around 10% from its June high. It tells us whether investors are braced for good news or caught leaning the wrong way. Based on the data, they’re leaning the wrong way.
Across the sentiment gauges I track — Fear and Greed, RSI, and momentum-fund positioning — investors are positioned defensively and appear emotionally exhausted. That’s not what the top of a bull market looks like. It’s what the early stages of a recovery often feel like. Bull markets don’t die on fear; they die on euphoria, and we’re sitting at the opposite end of that spectrum.
Meanwhile, the metrics and company commentary I read all point the same way: the demand picture is growing, not shrinking. Companies can’t satisfy their customers’ needs. Management teams are talking about visibility out into 2028. That tells me that the Nasdaq Composite is still set up for a steady long-term rally.
Five Stories Moving the Market:
U.S. President Donald Trump saying he’s not interested in extending the expiring agreement with Iran; Trump told reporters he would not seek an extension of the memorandum of understanding signed in June – Bloomberg. (Why you should care – that MOU, which expired yesterday, was intended to give the two sides 60 days to seek a more lasting peace deal)
U.S. and Canadian trade negotiators were haggling over a potential reduction in tariffs on Canadian vehicles to 15% after some value content deductions; the countries face a Wednesday deadline for steep new U.S. duties on $20 billion worth of other Canadian goods – Reuters. (Why you should care – the proposal would be a marked improvement from the current tariff rate of 25%)
China’s economic momentum slowed broadly in July, weighed down by muted consumer spending and slumping investment, according to official data – WSJ. (Why you should care – the surge in exports from China are increasingly being met by resistance from other nations concerned by a flood of cheap goods undercutting domestic industries)
The Federal Reserve's current policy rate is probably accommodative, if measured against a medium-run estimate of the so-called neutral rate at which borrowing costs are neither slowing nor boosting the economy, according to research published by the San Francisco Fed – Reuters. (Why you should care – most policymakers view the current level of interest rates as neutral to slightly restrictive)
Most British businesses say artificial intelligence has created new roles, according to the Lloyds Business Barometer; the survey suggested firms are moving beyond experimentation and starting to reshape hiring around the technology - Bloomberg. (Why you should care – the survey said 25% of businesses are hiring employees with AI skills while 20% are creating new roles around the technology)
Economic Calendar:
Earnings: JKHY, LZB, MRCY
U.K. – Unemployment Rate for June (2 a.m.)
Eurozone – ZEW Economic Sentiment for August (5 a.m.)
ECB’s Lane (Chief Economist) Speaks (7:45 a.m.)
U.S. – Building Permits, Housing Starts for July (8:30 a.m.)
U.S. – Export, Import Price Index for July (8:30 a.m.)
U.S. – Industrial Production for July (9:15 a.m.)
U.S. – Industrial, Manufacturing Production for July (9:15 a.m.)
U.S. – Pending Home Sales Index for July (10 a.m.)
Treasury Auctions $95 Billion in 6-Week Bills (11:30 a.m.)
U.S. - American Petroleum Institute Crude Oil Inventory Data (4:30 p.m.)


Comments