Cheap Money, Big Moves: Small Cap Stocks Are Back
- Christopher Garliss
- Dec 23, 2025
- 6 min read
Editor’s Note: The office will be closed next week. I will be putting out a year‑end portfolio update at the beginning of January. For the rest of this week, I will be highlighting catalysts I believe will support a continued rally next year.
This morning, I’m revisiting an analysis I put together on small cap stocks back in September. Given the sector’s domestic focus, Russell 2000 Index companies should benefit from lower interest rates, more favorable government regulations, and increased infrastructure spending. Wall Street expects earnings could grow 20% in 2026.
At the time I was highlighting the potential for a breakout and the potential gains that lie ahead. Since then, the Russell 2000 has broken out to new highs and rallied another 4%.
Cheap Money, Big Moves: Small Cap Stocks Are Back
Small cap stocks recently broke out to new highs.
This has happened three prior times since 2010.
The Russell 2000 Index averaged a 40% gain in 21 months in those instances.
The small cap stock rally is just getting started…
As I said last week, our central bank just handed investors a gift. Not only did it lower borrowing costs last Wednesday, but it also signaled there could be another 50 basis points of easing before the year is out. That should bode well for companies with a domestic business focus.
Wall Street has been quick to get on board. You see, the small-cap-heavy Russell 2000 is made up mostly of companies that do business in the U.S. Those index members draw roughly 81% of their revenue domestically, according to the financial services firm Morningstar. And last week, the index touched a new closing high…

When interest rates fall, borrowing costs drop. That’s a big deal for small-cap companies. These firms tend to rely on loans to fund growth, manage cash flow, and invest in operations. Lower rates mean less money spent on interest payments and more room to hire, expand, or launch new products.
It also helps their customers, because households and small businesses feel the relief too. When the Fed cuts rates, it’s trying to stimulate activity at home. That can boost demand for the goods and services small-cap companies provide. In short, falling rates grease the gears of Main Street and small caps are often the first to feel it. That’s why rate cuts can be a tailwind for this part of the market.
Since peaking in late 2021, the Russell 2000 is finally starting to break out. Last week, it made a new high for the first time in almost four years. For perspective, the S&P 500 and Nasdaq Composite indexes have been in that same trend for months. And based on what I see, small-cap stocks have lots of room to play catch-up and are headed even higher.
But don’t take my word for it, let’s look at what the data’s telling us…
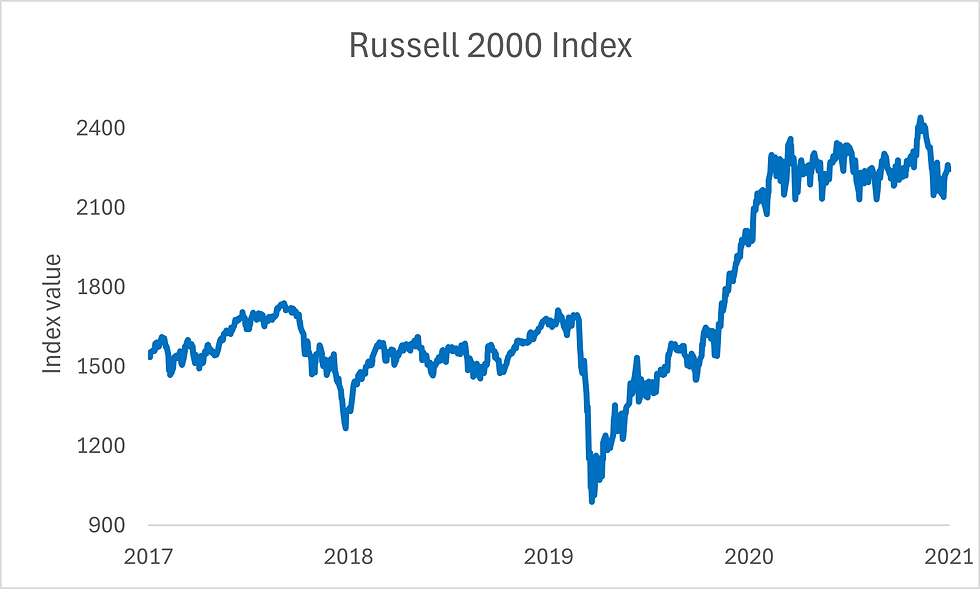
Let’s start with a chart showing the Russell 2000 over the last five years. In the graph below, you’ll notice the prior peak of 2,442 set back in November 2021 on the far left. Then, over on the right, you can see the measure just rose above that level…

This is a pattern that has played out before. In fact, it’s happened three prior times since 2010. That implies small-cap stocks have some catching up to do compared to their large-cap brethren. And when that rally is triggered, the Russell 2000 has averaged a 40% gain before the next peak.
So, let’s take a look…
In the above chart, you’ll notice the Russell 2000 peaked in September 2018 at 1,728. Over the following couple of years, the gauge moved sideways as the Federal Reserve raised interest rates. Then, you can see it collapsed with the COVID crash in early 2020.
It’s not until the domestic economic recovery in late 2020 that the small-cap gauge starts to rebound. In November 2020, the index finally made a new closing high at 1,747. The rally stalled in November 2021 when the gauge closed at 2,442. In those 12 months, it rose 39.8%.
We see the same scenario play out between 2015 and 2018…

As you can see in the graph, the Russell 2000 peaks in June 2015 at 1,294. From there, it experiences a steady drop into early 2016. At the time, investors were worried about collapsing economic growth in China. But once fears of a global meltdown were assuaged, small-cap stocks started rallying again. By late 2016, the small-cap gauge finally hits our trigger point, closing at 1,298. After rallying for 22 months, the index peaks in September 2018 at 1,740. Over that time frame, it gained just over 34%.
Now let’s look at our final example. We see the same setup and outcome play out between 2011 and 2015…

In May 2011, the Russell 2000 peaked at 865. Then it experienced a steady sell-off into October as investors worried about a European debt crisis and slowing U.S. growth. That fall, the Federal Reserve announced plans to buy $600 billion worth of U.S. Treasurys. The shift eased liquidity concerns, and stocks started rallying again.
By the end of 2011, domestic stock markets had recouped most of the losses from earlier that year. And by the start of 2013, they were breaking out to new highs. In January of that year, the Russell 2000 made a new closing high of 873, hitting the next trigger point. The rally kept going until June 2015, when the next peak was made at 1,294. During that span, the index gained over 48%.
Let’s look at the average duration and return over those periods…

Like I said at the start, small-cap stocks are breaking out. The Russell 2000 just made a new high. Based on the past three times we’ve seen this scenario play out, the index has averaged a 40% rally over the following 21 months. Don’t be surprised when this sequence of events happens once again.
Five Stories Moving the Market:
Nvidia has told Chinese clients it aims to start shipping H200 AI chips to China before the Lunar New Year holiday in mid-February; the U.S. chipmaker plans to fulfil initial orders from existing stock, with shipments expected to total 5,000 to 10,000 chip modules - equivalent to about 40,000 to 80,000 H200 AI chips – Reuters. (Why you should care – sales to Chinese customers beginning in mid-February should boost the first quarter earnings outlook)
Bank of America CEO Brian Moynihan said that artificial intelligence is starting to have a bigger impact on the U.S. economy; he said the firm anticipates economic growth next year of 2.4%, up from 2% in 2025 – Bloomberg. (Why you should care - Moynihan said his firm sees relatively limited risk to the economy if the AI industry became too overheated and had to pull back)
Commercial real estate today is more connected to AI than it ever was to previous tech rallies and selloffs; the property and infrastructure arms of major asset managers such as Blackstone and Brookfield have significantly raised their exposure to these properties in recent years, even if data centers remain a relatively small part of their overall investment portfolios – WSJ. (Why you should care – the U.S. Census Bureau expects spending on data center construction to surpass office building construction as soon as next year)
U.S. Federal Reserve Governor Stephen Miran said he is likely to remain on the central bank's Board of Governors beyond the expiration of his term until whoever President Donald Trump nominates as the next Fed chair is confirmed by the Senate – Reuters. (Why you should care – that means the rate setting Federal Open Market Committee is likely to maintain a dovish bent)
Alphabet has agreed to buy clean energy developer Intersect Power for $4.75 billion in cash, plus existing debt, marking one of the largest deals by the tech giant to dramatically expand its data center footprint for AI – Bloomberg. (Why you should care – the deal could ignite a buying spree where AI data center developers increasingly acquire their own power sources)
Economic Calendar:
Australia – RBA Meeting Minutes (12 a.m.)
Germany - Import Price Index for November (2 a.m.)
U.S. – ADP Employment Change Weekly (8:15 a.m.)
U.S. – Building Permits for September (8:30 a.m.)
U.S. – Durable Goods Orders for October (8:30 a.m.)
U.S. – GDP for Q3 (8:30 a.m.)
U.S. – PCE Prices for Q3 (8:30 a.m.)
U.S. – Real Consumer Spending for Q3 (8:30 a.m.)
U.S. – Housing Starts (8:30 a.m.)
Canada – GDP for October (8:30 a.m.)
U.S. – Industrial, Manufacturing Production for November (9:15 a.m.)
U.S. – Capacity Utilization Rate for November (9:15 a.m.)
U.S. – Conference Board Consumer Confidence for December (10 a.m.)
U.S. – Richmond Fed Manufacturing Index for December (10 a.m.)
U.S. – Atlanta Fed GDPNow for Q4 (11:30 a.m.)
Treasury Auctions $75 Billion in 6-Week Bills (11:30 a.m.)
Treasury Auctions $50 Billion in 52-Week Bills (11:30 a.m.)
Treasury Auctions $70 Billion in 5-Year Notes (1 p.m.)
Canada – BOC Summary of Deliberations (1:30 p.m.)
U.S. - CFTC’s Commitment of Traders Report (3:30 p.m.)
U.S. - American Petroleum Institute Crude Oil Inventory Data (4:30 p.m.)


Comments