Bull Markets Don’t Die on Fear — and Right Now, Fear Is All There Is
The relative strength index is approaching oversold levels.
Similar drops since 1980 have led to long-term buying opportunities.
The Nasdaq has averaged a 38% rebound over the following 24 months.
The recent drop in technology stocks is getting close to overdone…
July is typically a solid month for stock market investors. Since 1928, the S&P 500 has averaged a 1.7% gain in July. That has historically marked one of the strongest monthly performances of the year. When you consider it accounts for almost 20% of the S&P 500’s average annual gain of 9.7%, the numbers are even more impressive. However, so far this month, the index is down 1.7%, well below seasonality.
The major driver of the underperformance has been momentum investors exiting the technology sector — which is why the damage shows up far more clearly in the Nasdaq Composite than in the broad market. With company demand for compute power rising, the hyperscalers who provide the data center space are trying to build capacity to meet that demand. To do so, they’ve been tapping the debt and equity markets, and their free cash flow has dropped as capex outruns operating cash.
As a result, investors are increasingly questioning the ability of these companies to keep spending. They’re worried that at some point, an inability to borrow or sky-high interest rates will put an end to the spending cycle. And as we can see in CNN’s Fear and Greed index, investor anxiety has spiked…

The reading sits deep in “fear” territory. Yet typically, when Wall Street becomes this nervous, it proves to be overdone. When momentum investors grow uncertain, they tend to sell first and ask questions later — raising cash so they have money to put back to work once the picture clears.
Goldman Sachs’ Prime Brokerage unit recently said that the sale of technology stocks by momentum investors had reached an all-time high. It noted that the last time we’ve experienced anything this close was at the depths of the financial crisis as well as the dotcom bust. And based on the relative strength index, all of that selling has pushed tech stocks close to oversold territory. That should support a rally in the Nasdaq Composite as investors’ worries are placated.
But don’t take my word for it, look at what the data’s telling us…
The Nasdaq Composite’s relative strength index (“RSI”) is a simple momentum gauge that shows when buying or selling pressure has pushed too far in one direction. It runs on a scale of 0 to 100. Readings above 70 hint that buyers have overextended themselves, while drops below 30 suggest sellers have done the same. It doesn’t forecast fundamentals, it just tells you whether recent price action has been one‑sided enough to matter, often before the chart itself starts to turn.
As of yesterday, the gauge had slipped below 35 — its lowest reading since March and closing in on the 30 line. It hasn’t crossed into oversold territory yet. But it’s close enough that the history of what happens when it does is worth knowing…
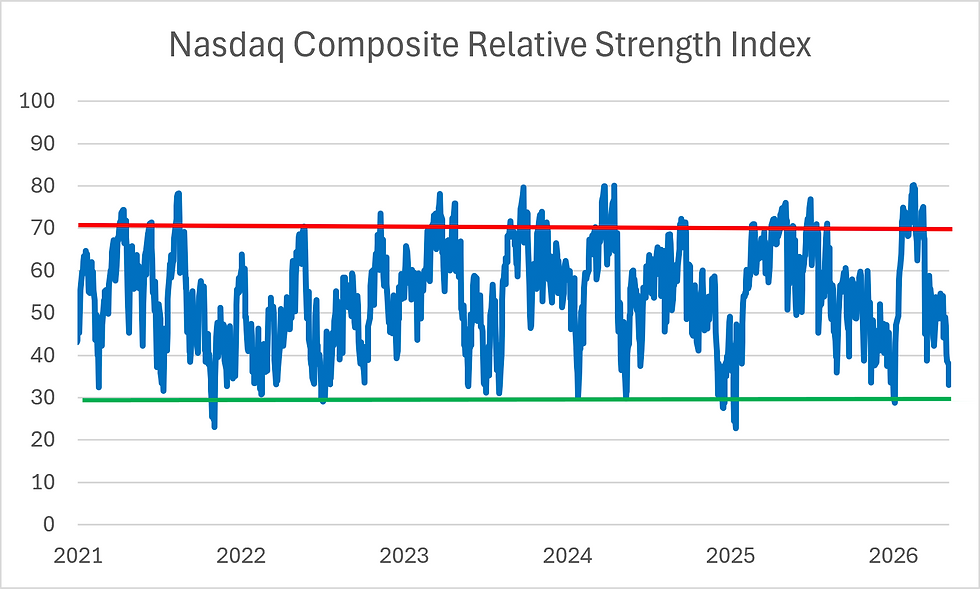
Given the drop, I wanted to see how the Nasdaq has performed after similar readings in the past. I focused on the cleanest version of the signal — a full move into oversold territory — and ran the numbers back to the start of 1980. What I found was there have been 127 instances where RSI has hit 30 or below.
Historically, those types of pullbacks have led to above-average returns for the Nasdaq Composite. The 12‑month price return numbers stand out: a 21% average gain with an 82% success rate, well ahead of the Nasdaq Composite’s long‑term 10.7% annualized return…

I find data like this especially timely given the Nasdaq is off around 10% from its June high. It tells us whether investors are braced for good news or caught leaning the wrong way. Based on the data, they’re leaning the wrong way.
Across the sentiment gauges I track — Fear and Greed, RSI, and momentum-fund positioning — investors are positioned defensively and appear emotionally exhausted. That’s not what the top of a bull market looks like. It’s what the early stages of a recovery often feel like. Bull markets don’t die on fear; they die on euphoria, and we’re sitting at the opposite end of that spectrum.
Meanwhile, the metrics and company commentary I read all point the same way: the demand picture is growing, not shrinking. Companies can’t satisfy their customers’ needs. Management teams are talking about visibility out into 2028. That tells me that the Nasdaq Composite is still set up for a steady long-term rally.
Five Stories Moving the Market:
Kevin Warsh has staked his chairmanship on the premise that a quieter Federal Reserve gets a cleaner read on what investors think; Warsh said nominal and inflation-adjusted Treasury yields had risen since his debut meeting in June, as investors responded to the economy – WSJ. (Why you should care – Warsh said the rise in Treasury yields were doing the Fed’s job ro it, removing the need for interest rate hikes)
Microsoft’s cloud unit grew at the fastest clip in four years and the pace is accelerating, suggesting the company’s AI and computing services are making inroads with customers – Bloomberg. (Why you should care - Chief Financial Officer Amy Hood said demand continues to outstrip supply while suggesting the company plans to hold the line on its capital expenditure plans)
Meta Platforms reported a 91% drop in second-quarter free cash flow; the Facebook and Instagram parent company reported free cash flow of $784 million in the second quarter ended June 30, down from $8.55 billion a year earlier – Reuters. (Why you should care – the company said it expects to spend $145 billion on AI infrastructure this year, almost double last year’s total)
Samsung Electronics’ semiconductor arm reported a more than 250-fold jump in profit, reflecting the headway it’s making against rival SK Hynix in the AI memory boom; the unit reported operating income of 89.2 trillion won ($62 billion) compared to the expectation for 79.3 trillion won – Bloomberg. (Why you should care – the company said it expects supply constraints to continue given the volume of demand)
American forces carried out strikes against Iran, in what the U.S. military called a “powerful response” to Iran’s missile attacks on U.S. forces in Jordan; the strikes came hours after U.S. President Donald Trump vowed to retaliate for Iranian ballistic missile strikes – WSJ. (Why you should care – U.S. military officials downplayed the response, saying it didn’t amount to a major combat operation)
Economic Calendar:
Earnings: AAPL, AEP, AMZN, BMY, BUD, CI, ICE, KKR, MA, MO, PWR, SO, SYK, TT
Japan – Household Confidence for July (1 a.m.)
Spain – CPI (Preliminary) for July (3 a.m.)
Eurozone – Consumer Confidence for July (5 a.m.)
Eurozone – GDP for Q2 (5 a.m.)
Bank of England Monetary Policy Announcement (7 a.m.)
BoE Meeting Minutes (7 a.m.)
Germany – CPI (Preliminary) for July (8 a.m.)
U.S. – GDP for Q2 (8:30 a.m.)
U.S. - Initial Jobless Claims (8:30 a.m.)
U.S. - Continuing Claims (8:30 a.m.)
U.S. – PCE for June (8:30 a.m.)
U.S. – Personal Income, Spending for June (8:30 a.m.)
BoE’s Bailey (Governor) Speaks (9:15 a.m.)
U.S. – Dallas Fed Trimmed Mean PCE for June (10 a.m.)
Fed's Balance Sheet Update (4:30 p.m.)
South Korea – Industrial Production for June (7 p.m.)
Japan – Tokyo CPI (Preliminary) for July (7:30 p.m.)
Japan – Industrial Production for June (7:50 p.m.)
Japan – Retail Sales for June (7:50 p.m.)
China – Official Manufacturing, Non‑Manufacturing, Composite PMI for July (9:30 p.m.)
Bank of Japan Monetary Policy Announcement (11 p.m.)


Comments