The Midterm Playbook: Year Two Jitters, Year Three Payoff
- Christopher Garliss
- 2 minutes ago
- 5 min read
Editor's Note: Earlier this year, I broke down midterm election cycle dynamics and what they mean for the stock market. With political temperatures rising as primaries get underway, it's a good time to revisit that analysis. The second chart, comparing this year's S&P 500 performance to the typical year-two pattern, has been updated through last night's close: the index is up 12% year-to-date versus the typical 1.5% decline.
Year Two Weakness, Year Three Strength: A 70‑Year Pattern
Year Two of the presidential cycle is the weakest for the S&P 500.
The market tends to trough mid-year before a sharp fourth-quarter rally.
Year Three tends to see strong outperformance.
The market is behaving exactly as history says it should, even if it doesn’t feel like it…
In case you haven’t noticed, the midterm election cycle is getting underway. The early signs are already spilling into the market narrative. Campaign messaging is ramping up, policy trial balloons are being floated, and the headlines have taken on that familiar edge of political theater. The uncertainty associated is exactly why the second year of a presidential term has earned its reputation as the most volatile of the four‑year cycle.
You see, the stock market doesn’t respond well to ambiguity, and midterm years are full of it. Institutional investors tend to sell first and ask questions later. The data shows the S&P 500 almost always stumbles early, bottoms mid‑year, and then claws its way back as the political picture sharpens. Going back to 1950, Year Two consistently delivered the weakest returns, with an average gain of just 4.6%…

But that’s only part of the story. As the table above makes clear, the outlook improves dramatically once we cross into Year Three. Once the midterm results are known and the policy trajectory becomes clearer, uncertainty fades and positioning resets. Investors don’t need perfection, they just need direction. And Year Three reliably provides it.
Based on what we’ve seen so far, this year is tracking to script. The market is off to a choppy start, bouncing between gains and losses. And with what looks like a heated midterm run ahead, the volatility isn’t disappearing in the near term. But the data is unambiguous: as the summer approaches and the election outcome begins to take shape, the environment typically stabilizes. That clarity has historically fueled a strong fourth‑quarter acceleration and a constructive setup heading into the following year. If history is any guide, the S&P 500 should find its footing as the political fog lifts, leading to a steady rally.
But don’t take my word for it, let’s look at what the data’s telling us…
When we break down the second year of the presidential cycle, the pattern is remarkably consistent. The S&P 500 tends to struggle early, often posting its weakest returns of the entire four‑year cycle. That outcome isn’t random. Midterm years are full of unresolved questions: who will control Congress, what policy agenda will survive, and how aggressively the administration will pivot to shore up support. Investors don’t like uncertainty, and the data shows it.
We can see this clearly in the month‑by‑month data. When we normalize each cycle to the same baseline, the average Year‑Two path shows a familiar pattern: a choppy first quarter, a soft spring, and a mid‑year trough that often coincides with peak political noise. Once the primary season ends and the contours of the midterm outcome begin to appear, investor conviction rises and the stock market starts to recover. By the fourth quarter, the S&P 500 typically regains its footing because uncertainty finally begins to fade…

But the real inflection point comes in Year Three, and the contrast is striking. Once the midterm results are known, the policy trajectory becomes clearer. Investors transition from reacting to uncertainty to anticipating the next phase of the cycle. Historically, Year Three is the strongest of the four, with an average annual price gain of 17.2%. That dwarfs the other years and far exceeds the S&P 500’s lifetime average of 9.5% on a total‑return basis (dividends reinvested).
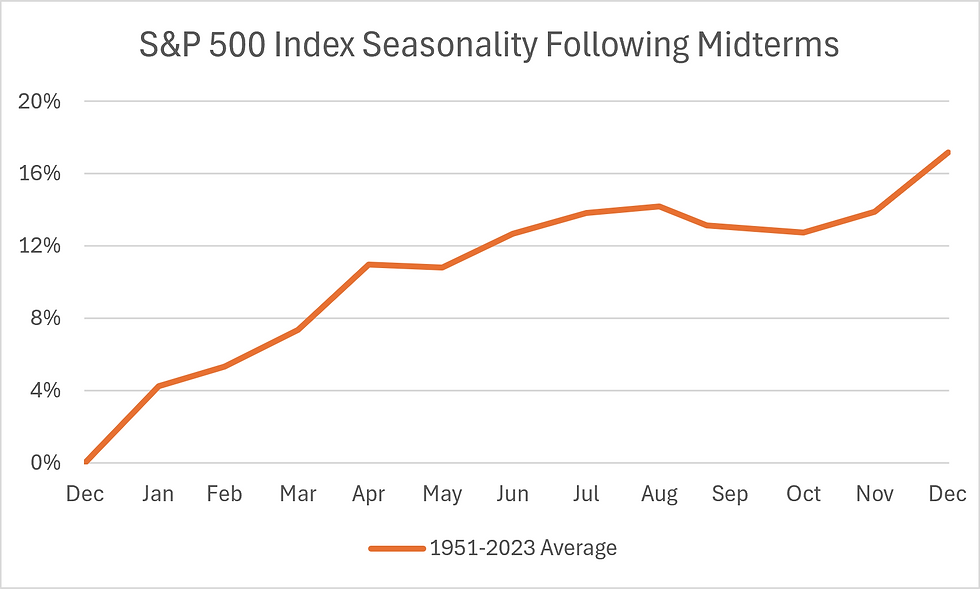
Bottom Line: While things may feel uncertain right now, this kind of turbulence is exactly what midterm years are known for. The headlines get louder, the narratives get darker, and markets chop as investors try to make sense of shifting political and economic signals.
But history is clear: these drawdowns are usually the setup, not the story. Once uncertainty begins to resolve and the election comes into focus, markets tend to stabilize, recover, and finish the year on firmer footing. If the past seven decades are any guide, the discomfort we’re feeling today is part of a well‑worn pattern that has repeatedly given way to stronger returns on the other side.
Five Stories Moving the Market:
Canada and the United States are "very close" to agreeing a trade deal according to Minister of Trade Dominic LeBlanc; the proposed deal is expected to cut the top-line tariff on Canadian-built vehicles to 15% from 25% and halve tariffs on Canadian steel and aluminum to 25% - Reuters. (Why you should care – a deal would help to ease nearly two years’ worth of tensions between the two nations)
Samsung Electronics plans to announce a new shareholder return package that could be worth as much as $79 billion; that would make it one of the company’s most significant capital-return initiatives – Bloomberg. (Why you should care – similar capital return initiatives by competitors Micron and SK Hynix could spark the next leg of the rally in the semiconductor space)
Surging healthcare costs are walloping U.S. workers, and they will only worsen next year; for 2027, employers may be facing the biggest health-insurance increase in at least two decades, according to benefits-consulting firm Aon - WSJ. (Why you should care – surging healthcare costs are likely to weigh on corporate margins)
Japan's core consumer inflation accelerated in July from a year earlier as firms passed on rising import costs from a weak yen; the core consumer price index, which includes energy-related items but excludes volatile fresh food prices, rose 1.8% in July from a year earlier, following a 1.6% increase in July – Reuters. (Why you should care – the data lend support toward additional rate hikes by the Bank of Japan)
U.S. Treasury Secretary Scott Bessent said that he’s prepared to expand efforts to buy back costlier debt and that the administration will be unveiling a new fiscal initiative to address the highest borrowing costs in years – Bloomberg. (Why you should care – hedge-fund titan Bill Ackman used similar volatility to short U.S. Treasury bonds in August 2023, covering the bet in October of that year when the Treasury Department stepped up support)
Economic Calendar:
Earnings: BJ, BKE
U.K. – Retail Sales for July (2 a.m.)
Eurozone – HCOB Eurozone Manufacturing, Services, Composite PMI (Preliminary) for August (4 a.m.)
U.K. – S&P Global U.K. Manufacturing, Services, Composite PMI (Preliminary) for August (4:30 a.m.)
U.S. – S&P Global U.S. Manufacturing, Services, Composite PMI (Preliminary) for August (9:45 a.m.)
Eurozone – Consumer Confidence for August (10 a.m.)
U.S. - Baker Hughes Rig Count (1 p.m.)
U.S. - CFTC’s Commitment of Traders Report (3:30 p.m.)
Fed Releases Balance Sheet Updates on Commercial Banks (4:15 p.m.)


Comments